| Celestial Cartography (Sky Mapping)David Ratledge |
|
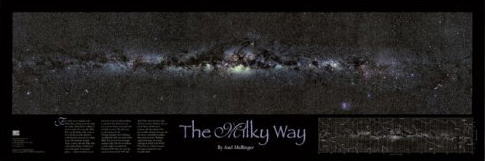
IntroductionAnyone who has seen Axel Mellinger's spectacular Milky Way Poster (published by Sky & Telescope) cannot have failed to be impressed and probably inspired to do something similar. His magnificent mosaic of the Milky Way captures the glory of our home galaxy as never seen before. It suddenly becomes obviously an edge-on spiral galaxy! Mellinger obtained 18 wide-angle images over a span of 2-1/2 years, travelling to observation sites around the world to complete the mosaic. What sets this image apart is that it is displayed in the Galactic Coordinate System which results in the Milky Way becoming that edge-on galaxy. So how does one get from simple wide-field images of the Milky Way that so obviously curve across the sky, to one where the galactic plane is truly horizontal? Well it is now possible for us ordinary mortals to attempt such an image - thanks to Christian Buil and his free software, IRIS. The results here are somewhat more modest that Mellinger's but demonstrate how we can assemble a map the sky and display it in a variety of coordinate systems including that impressive Galactic one. I just need now another 14 images to complete it! |
|
Getting StartedWhat we need is a suitable set of wide-field images of the Milky Way. Suitable means they need to have sufficient overlap and ideally have north at top. This latter point will make registering them much easier. They also need to be of the same exposure, colour balance and brightness - or at least as near as possible - otherwise the result will not have "invisible" joins. It will be more like a patchwork quilt and as you will see further on I didn't get this spot on. It is not easy as the different altitudes of the individual frames means each image will suffer from different amounts of light pollution gradients. Getting everything identical is all but impossible unless you can travel to pristine dark skies. The frames I am going to use were shot at Kelling Heath in Norfolk, England using a Canon 300D (filter modified) and a 28mm lens. The exposures were 8 x 5 minutes at f/8. and they suffered from varying amounts of light pollution. There was a considerable amount of pre-processing work to get them into the state you see below. |
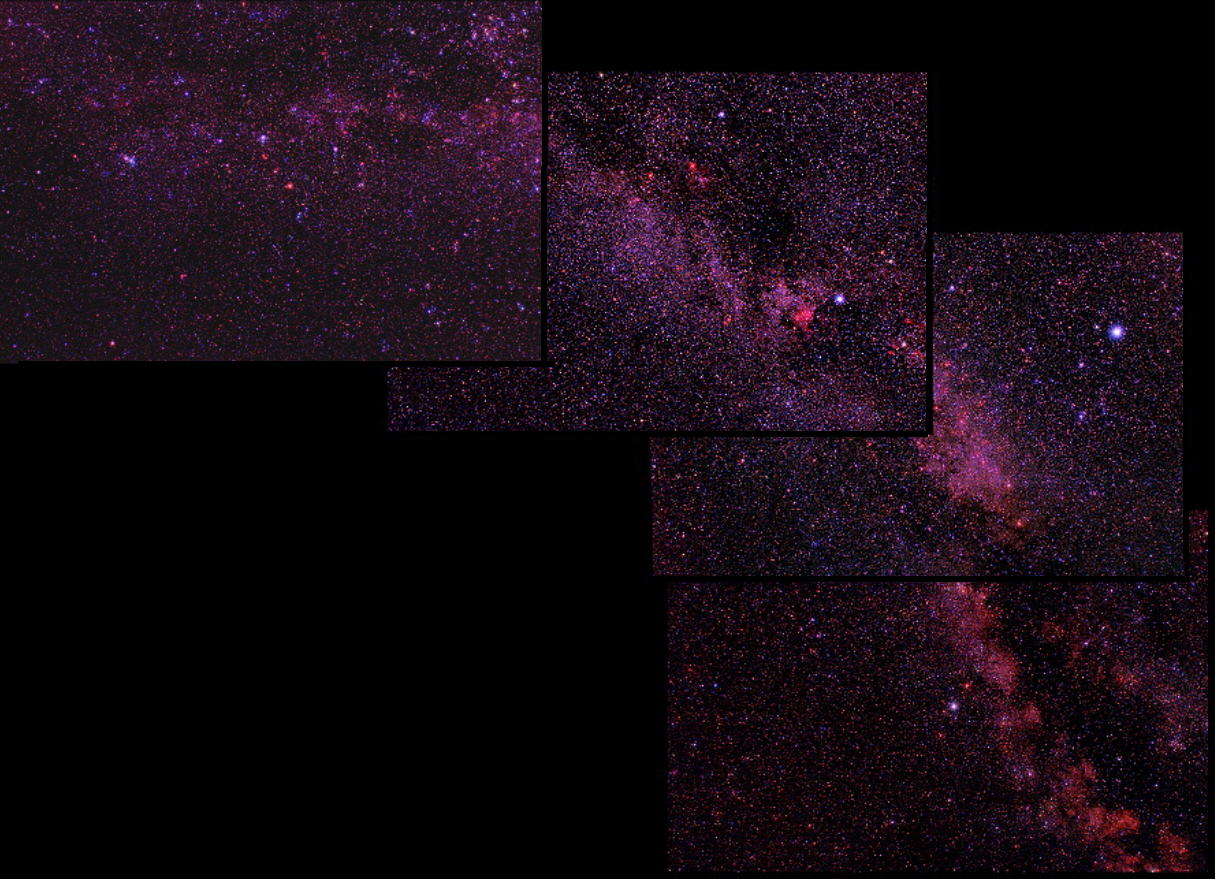 |
Suitable images: Sufficient overlap and resonably consistent colour balance
|
Making the ConnectionIt is, of course, much simpler to just join the images together using panorama or stitching software - the type that often comes free with your camera or is available from many sources in the Web. However, this is very crude and will certainly not produce sky maps to astrometric precision. Going this route you will inevitably end up with double stars in parts of the mosaic - a poor example of this is in Sky & Telescope's Beautiful Universe 2010. There is a better way - read on! So instead we are going to use IRIS and its "Mapping the Sky" set of tools. These were introduced in version 5.50 and there is 40 page tutorial explaining the process. I am not going to reproduce the instructions here, just give a quick flavour of the process and demonstrate the kind of results possible. There are 5 steps to the process:
|
Step 1- Finding the coordinates of the Centre of Each ImageRelatively straightforward but don't get over confident just yet as later stages are very much more complex. I simply opened two windows - one of the image and one of planetarium software (SkyMap). The RA and DEC can then be estimated. It doesn't have to be to the arc second - approximate is near enough. We will get the exact coordinates later. Step 2 - Correct for the Optical Distortion of the Camera LensIf we use the same lens for each image (highly recommended but not essential) then we only need to measure the optical distortion once and then apply to each image. For this it is best to select an image without a horizon and with the least clutter of stars (not easy when imaging the Milky Way). The technique then is to compare the positions of the stars in the image with a catalog of star positions. IRIS has the option of a variety of catalogues but SKY2000 is recommended for images with wide-angle lenses. This covers stars down to magnitude 9 which will be more than adequate. Having north vertical in our images will make aligning the two much more straightforward. So if your images don't have north vertical now would be a good time to rotate them. It is also best to work in monochrome for this step and the green channel (with greatest signal to noise ratio) is recommended. The image and the sky catalogue are overlayed and to make what is going on easy to see, the stars from the catalogue are shown as circles - see below. |
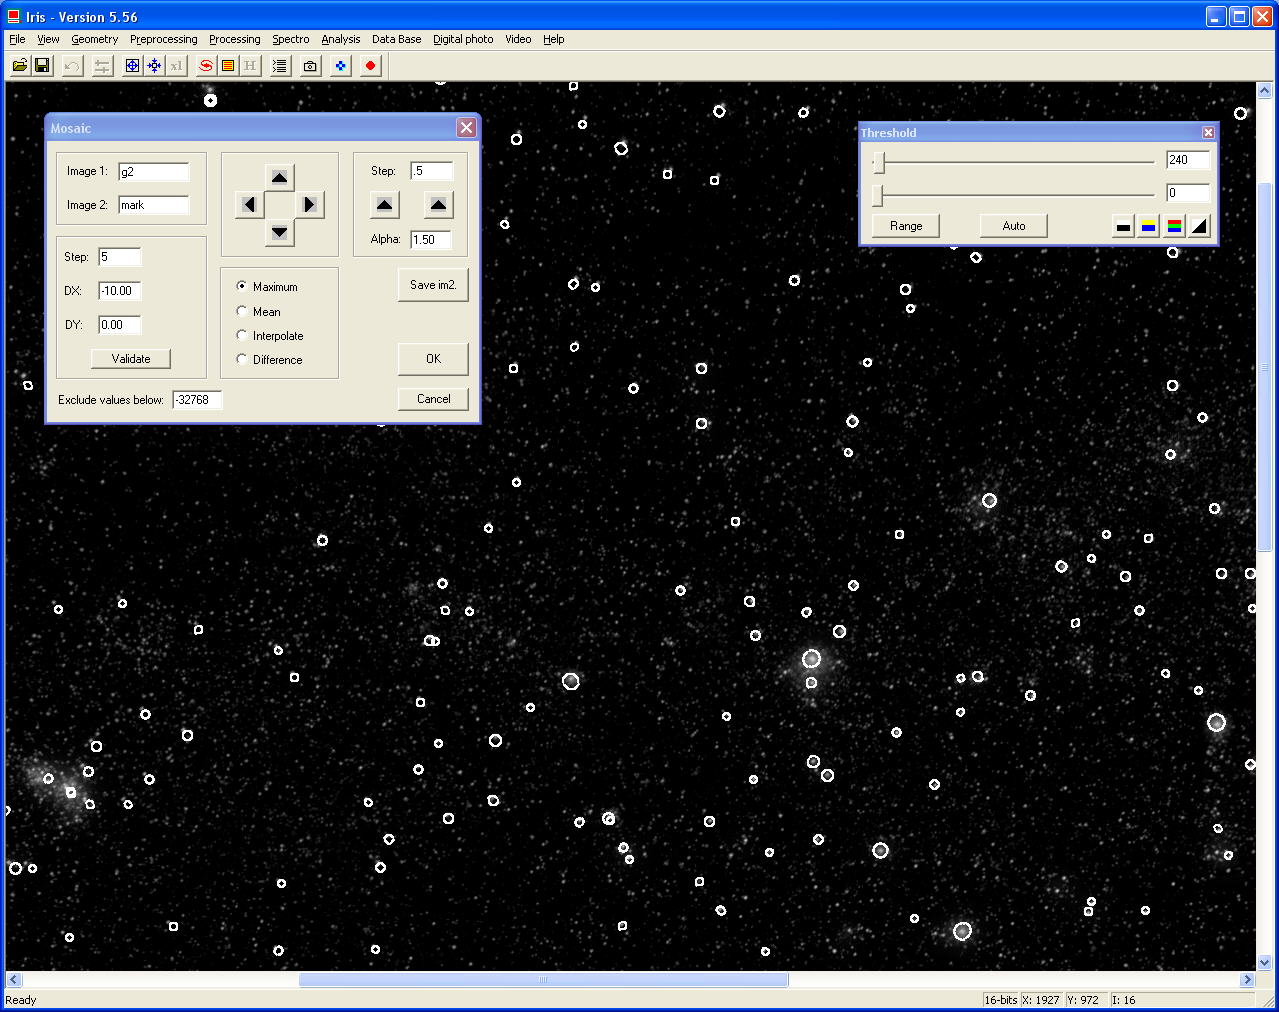 |
We have had to apply (manually by trial and error) some translation (in the x and Y direction) together with a small amount of rotation to get a reasonable match. It is then a question of going throughout the image identifying matching pairs of real stars with catalogue stars and marking them with a surrounding rectangle. I collected about 50 pairs evenly spread across the image. The software can then compute the lens distortion. For my camera lens it appeared that it suffered primarily from "pin cushion" distortion. Its exact focal length was also determined and my 28mm lens turned out to have an actual focal length of 28.15mm. Having calculated the distortion paramaeters we can now use the command "Correct Distortion" for all 4 images in turn. IRIS remembers the distortion coeficients but it is a good idea to make a note of them. It is also a good idea to compare these new distorted (or is it undistorted?) images with the star catalogue again. All should be well and we can proceed to the next stage. |
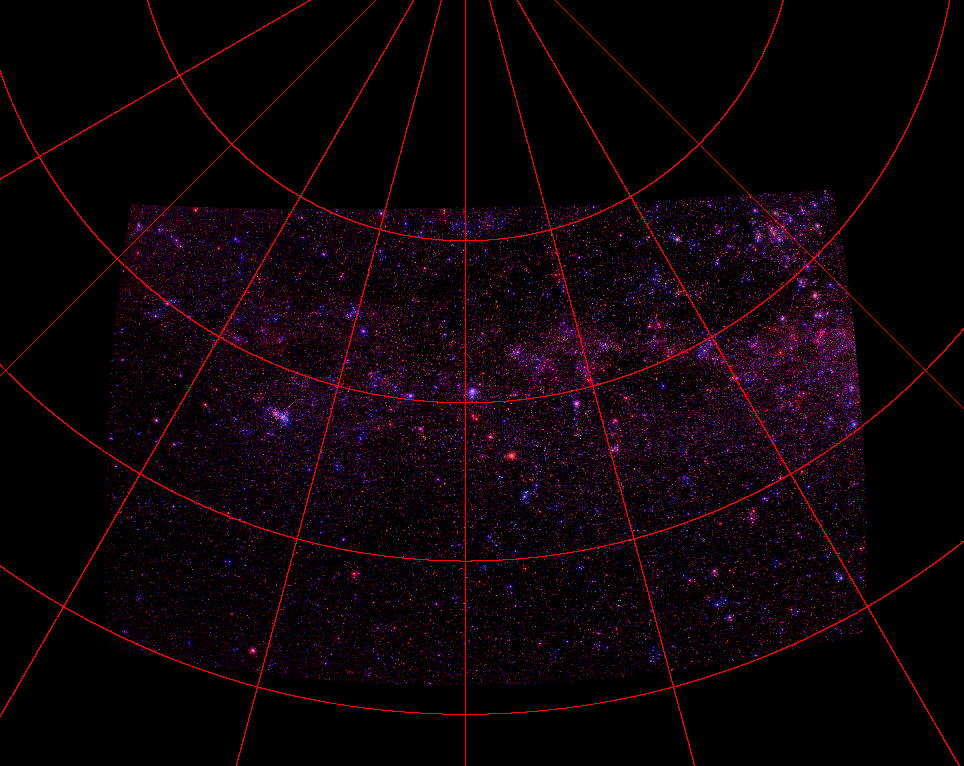
Step 3 - Astrometric TransformationThis is most powerful part of the process. It will align each pixel in our images with real RA and DEC positions. Having done so we will be well on the way to producing true astrometric maps of the sky and the Galaxy. We will again use the SKY2000 catalogue but having corrected the optical distortion of the lens this process can be automated. We will apply an affine transformation to each image in our set. I had trouble with a couple of my images failing to register automatically. However, there two parameters that can be tweeked to get around this and I found that by reducing the amount of stars (dropping the magnitude limit to 7) solved the problem. The new images are then best saved in several safe places, as having got this far, they are far too valuable to risk losing! Step 4 - Cartographic ProjectionThe exciting bit. The procedure in Iris is to firstly apply the same cartographic projection to each image and then secondly join them together. For 4 images this is not a problem but with a bigger set I could imagine it becoming a bit arduous. For this step we use the command "Stellar Map Projections". IRIS has 3 coordinate systems and 7 different projections. Some are optimised for zenithal (polar) regions whilst other are better for equatorial regions. Some are good at preserving constellation patterns whilst others attempt to equalise sky areas. All of them are of course a compromise as depicting a curved sky on a flat screen means something has to give. Cartographers are fully familiar with these issues. Below is a single image depicted in the Equatorial Coordinate system using a Lambert Zenithal Equal Area Projection. The grid lines are produce by a second command and each line is added individually. Of course the same projection has to be selected. There are some tricky options to set at this stage such as image scale, size and boundary. It took a considerable number of trials before I could get these just right. In addition some "artifact" images could well appear. These look like distorted images from another dimension but are generally away from the area of interest but are disconcerting when first seen! Don't worry - carry on and apply the same projection to each image before saving them under a new name. For an image montage it is best to leave the grid lines till later. |
|
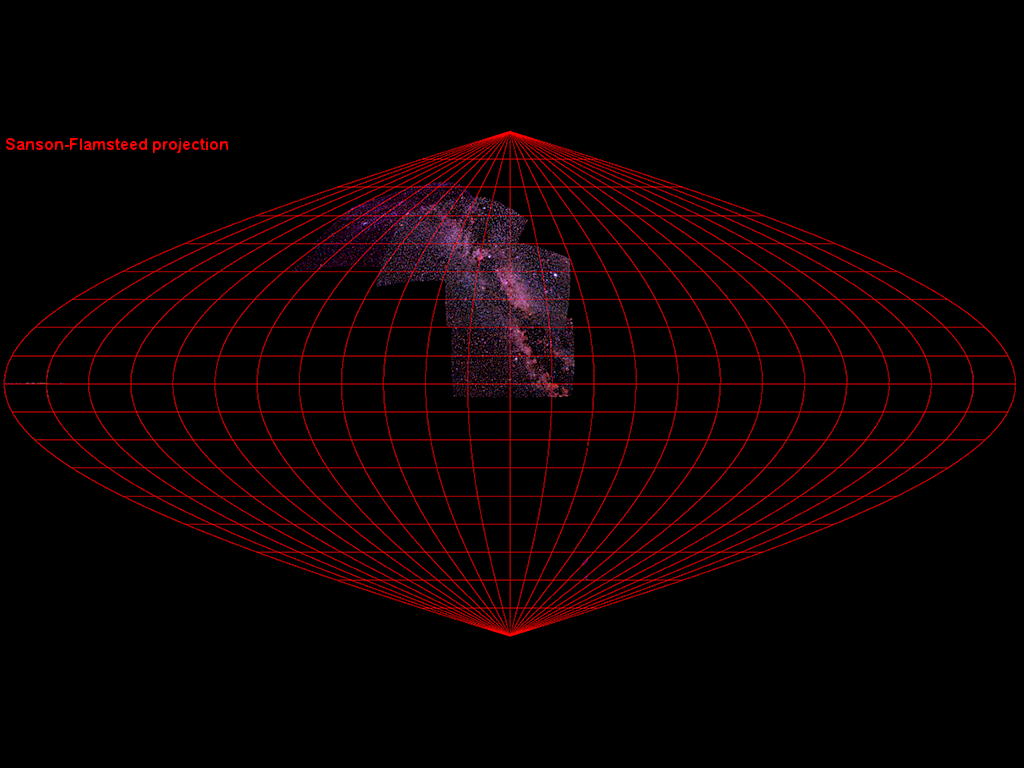
Step 5 - Assemble the MosaicThis is where attempts to equalise the colour balance and brightness of the images becomes apparent. I said it was tricky setting the image scale and boundary and expect to get it wrong first time. IRIS offers two methods for superimposing the images - a visual mosaic one and a command line (DOS type). It also has options for treating image edges which I found didn't help with my images. I opted for the command line (pano_mean) approach as this surprisingly was by far the easiest and quickest. Below is an all sky Sanson-Flamsteed Projection. We might think our images have covered a large part of the sky but in reality mine have not. This projection suffered from several of those artifacts I mentioned, which had to be deleted but the result is worth the effort. IRIS has a command, "Fill2" for clearing areas of an image and this can be used to clean up any spurious artifacts. This obviously best done before any grid lines are added.
|
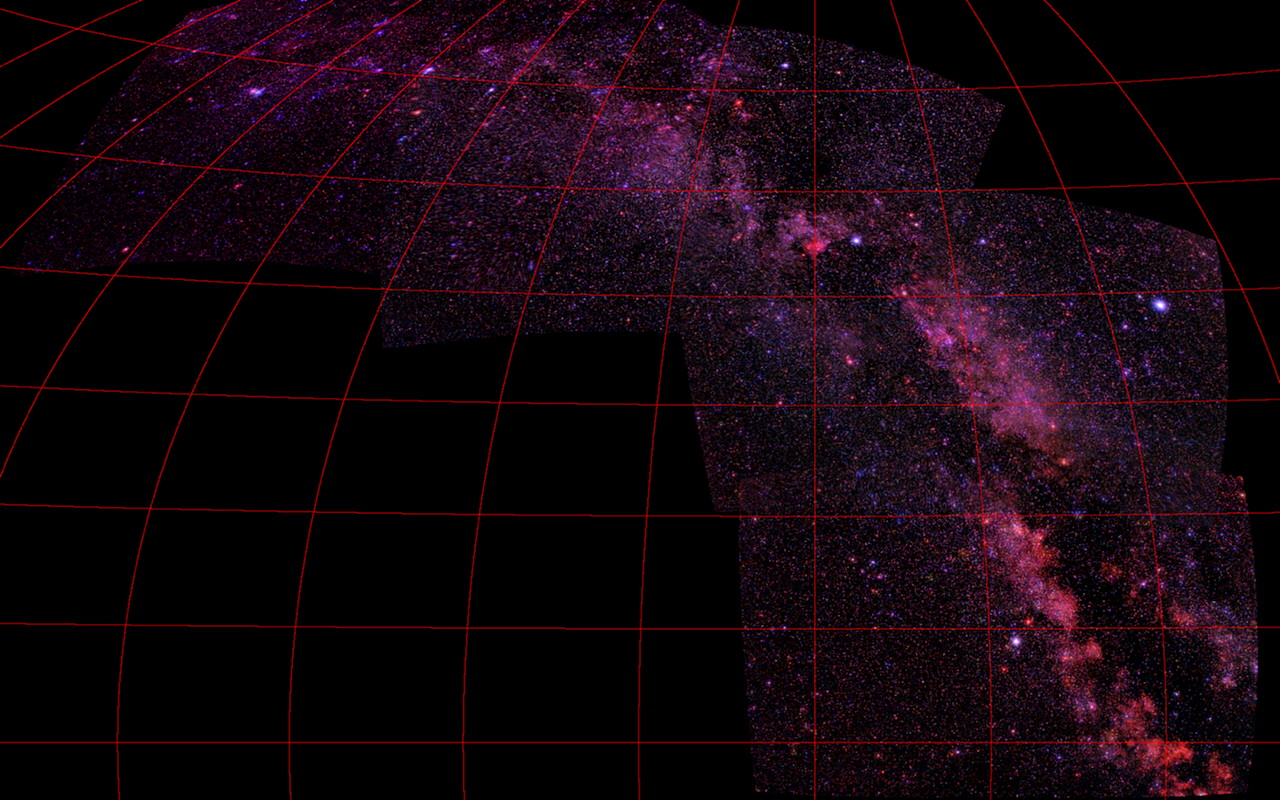
The image below has used a Lambert Zenithal Equal Area Projection. You can see the declination line spacing decreasing towards the equator. This projection has a very "flat" appearance but constellations are easily recognised as they are largely undistorted.
|
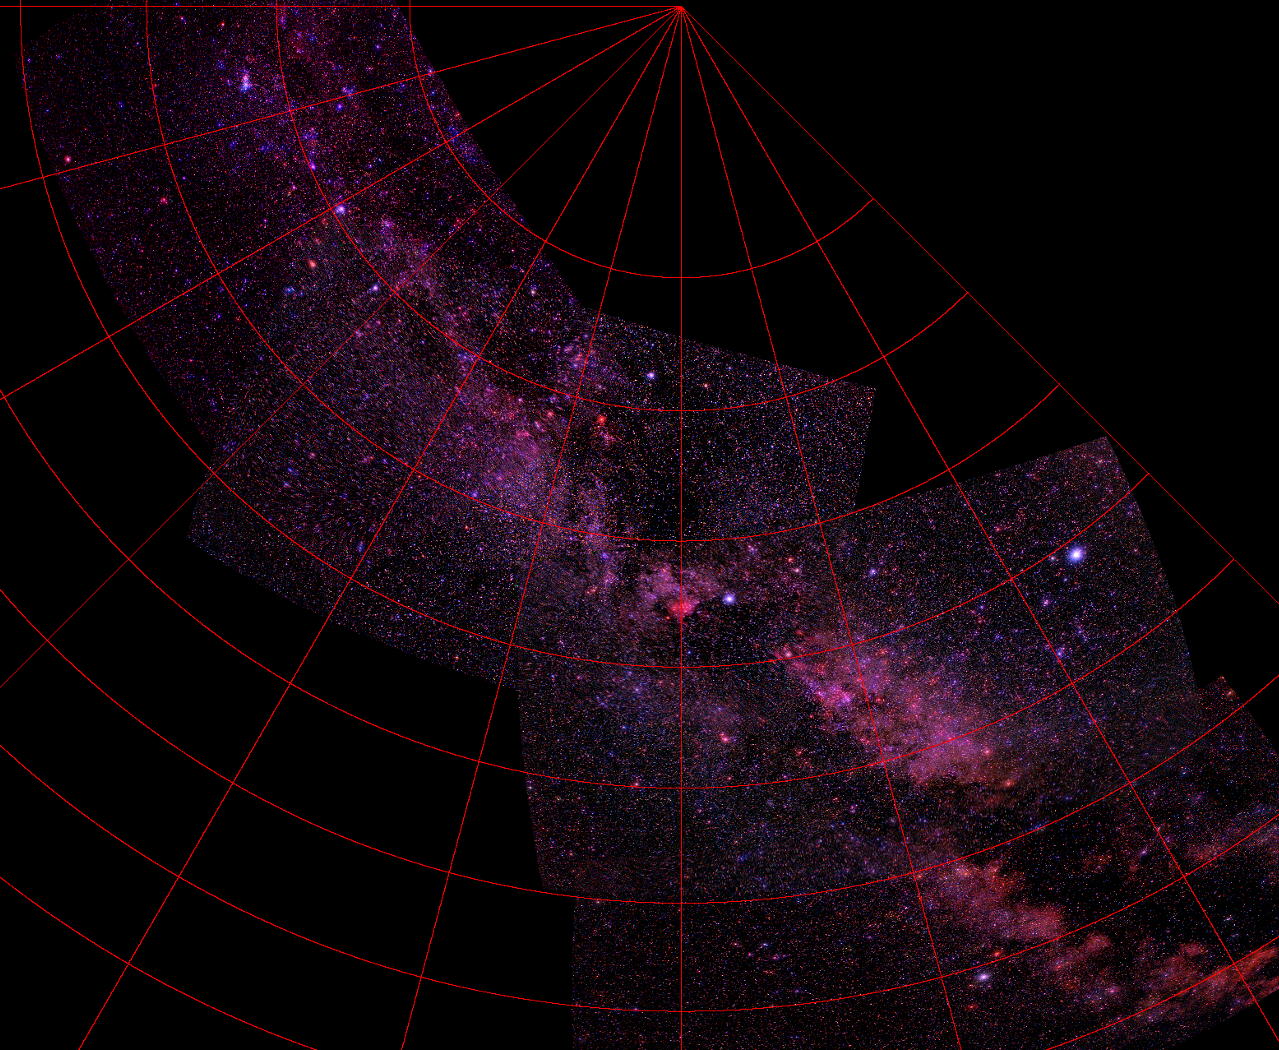 |
The image below has used an Aitoff Projection. The result is a much more "3D" appearance with a sense of curving towards the pole at the top but constellation patterns in this area are harder to recognise.
|
 |
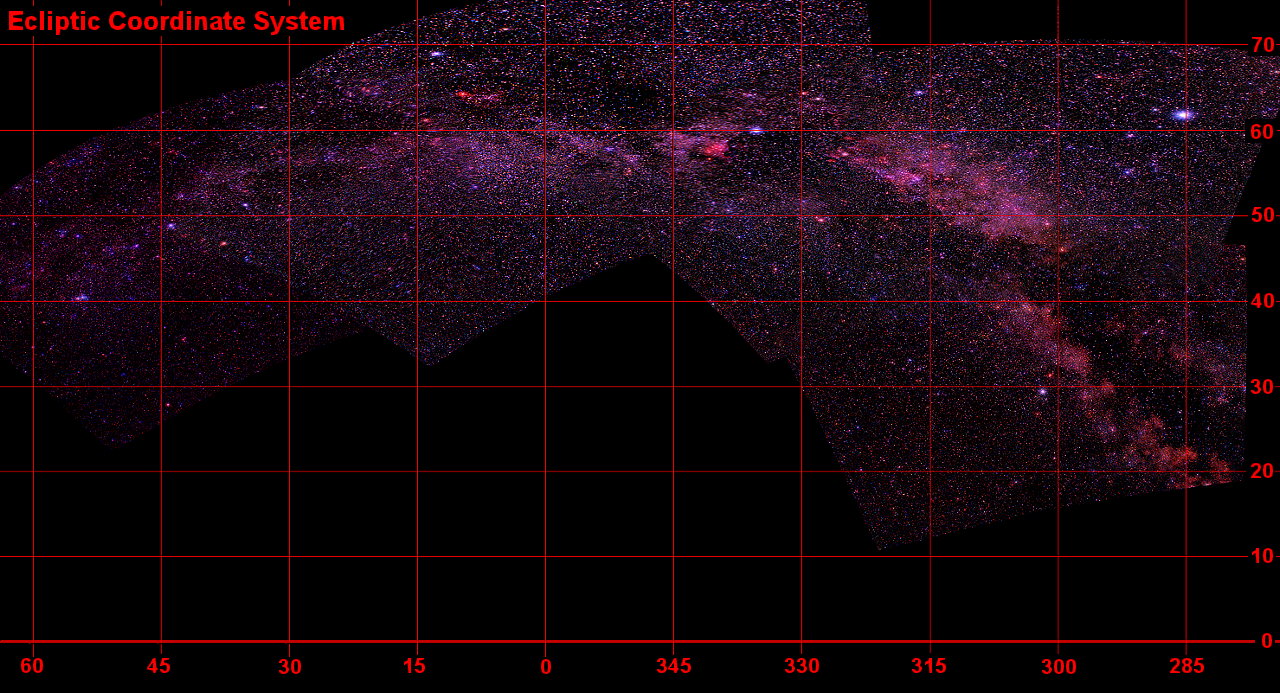
Next I attempted converting to Ecliptic Coordinates i.e. compared the plane of our solar system. There is a real impression of how much we are tilted relative to our galaxy with this system. I did encounter some quirks in IRIS with regards to the grid lines when in Ecliptic coordinates. They appeared to have a factor of 2 applied to them so the lines drawn were in error but the values displayed here have been corrected.
|
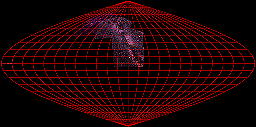
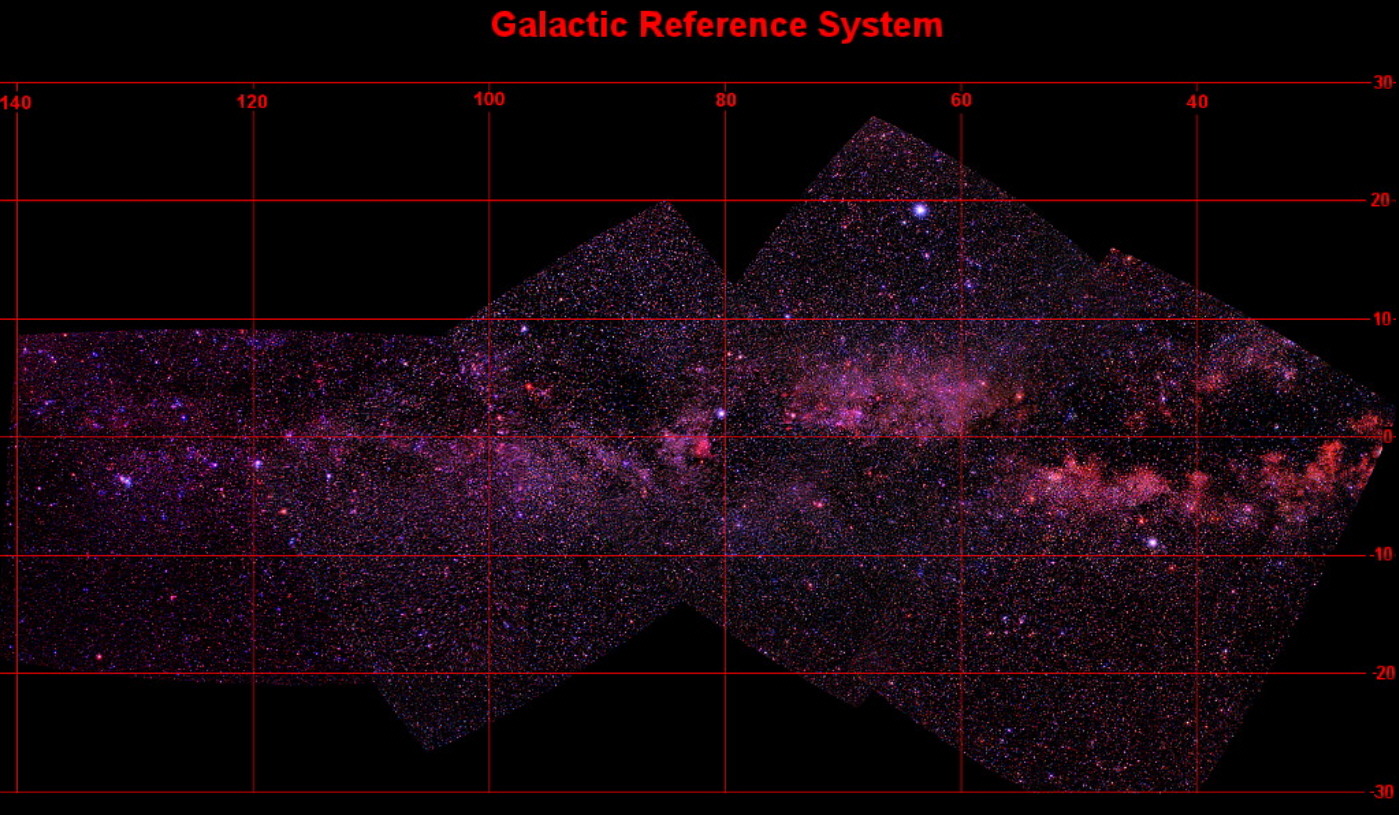
Finally, we switch to a Galactic Coordinate System, that of our Milky Way Galaxy. Not quite as spectacular as Axel Mellinger's but we are getting there and the bulge towards the galactic centre is evident. A simple cylindrical projection has been used with the latitude and longitude numerical values added later in a graphics program. |
 |
|
Producing a sky map to astrometric precision using IRIS is a complex and, at times, frustrating project. However, the results are well worth the effort involved and perseverance will be rewarded. Thanks must go to Christian Buil for writing the software and putting these tools in the public domain. I just can't wait to expand my set of images.
|